

Pakistan’s federal development programme had an allocation of Rs1 trillion for 2026–27, but the Ministry of Planning’s October expenditure sheet records only Rs103.88 billion spent between July and October. That is about 10.4 per cent of the annual allocation. The same sheet shows that Rs412.29 billion had been authorised, making the difference between an approved spending ceiling and money actually used the central issue in the latest figures.
The numbers matter to people waiting for roads, water schemes, schools, hospitals and power infrastructure. They also need careful reading: a low four-month utilisation rate is a warning sign to investigate, not proof by itself that every project is delayed or that the remaining allocation will not be spent.
What the October PSDP figures actually show
The Public Sector Development Programme (PSDP) is the federal government’s project budget. It is separate from routine salaries, pensions and day-to-day operating expenditure. The October summary reports the following position for the first four months of FY2026–27:
| Measure | Amount | Share of annual allocation |
|---|---|---|
| Annual federal PSDP allocation | Rs1,000.00bn | 100% |
| Funds authorised by October | Rs412.29bn | 41.2% |
| Actual expenditure recorded | Rs103.88bn | 10.4% |
| Authorised amount not yet spent | Rs308.42bn | 74.8% of authorised funds |
One useful calculation is that actual expenditure equalled roughly 25.2 per cent of the amount authorised by the end of October. In other words, authorisation had moved much further than recorded spending. The difference is not automatically an unpaid bill or a lost allocation; it is the amount that had been authorised but had not yet appeared as expenditure in this summary.
Allocation, authorisation and expenditure are not the same thing
These three terms are often used interchangeably in headlines, but they describe different stages.
- Allocation: the amount set aside for a programme or project in the annual development budget. It is a budget provision, not a payment.
- Authorisation: the amount that the Planning Commission has cleared for release or use under the applicable release process. Authorisation does not mean the contractor, supplier or project office has already received the money.
- Expenditure: the amount recorded as spent in the reporting system. It is the closest of the three measures to actual financial execution, although it does not by itself prove that a project has been physically completed.
A project can therefore have a large allocation and an authorisation but still show limited expenditure. Possible explanations include procurement timelines, land acquisition, design revisions, delayed tenders, contractor mobilisation, payment documentation or the planned timing of work. The October summary does not identify the cause for every project, so it would be wrong to assign one explanation to all departments.
Where spending was concentrated — and where utilisation was lower
The ministry-wise sheet shows large differences between sectors. The percentages below are calculated by comparing each division’s recorded expenditure with its full-year allocation; they are not official project-completion rates.
| Division or corporation | Annual allocation | Spent by October | Share used |
|---|---|---|---|
| National Health Services | Rs16.06bn | Rs6.61bn | 41.1% |
| Federal Education and Professional Training | Rs36.31bn | Rs6.88bn | 18.9% |
| Water Resources | Rs103.09bn | Rs18.73bn | 18.2% |
| Power Division (NTDC/PEPCO) | Rs88.00bn | Rs15.92bn | 18.1% |
| Railways Division | Rs40.66bn | Rs4.65bn | 11.4% |
| Higher Education Commission | Rs46.00bn | Rs4.71bn | 10.2% |
| Information Technology and Telecom | Rs19.58bn | Rs1.45bn | 7.4% |
| National Highway Authority | Rs224.51bn | Rs13.30bn | 5.9% |
| National Food Security and Research | Rs4.18bn | Rs0.06bn | 1.6% |
The table is a screening tool, not a league table of performance. A department with a smaller allocation can show a higher percentage after one payment, while a large construction project may spend in stages. The National Highway Authority, for example, has a much larger annual allocation than the health division, so its absolute expenditure and percentage utilisation tell different stories.
Why the federal total is not Pakistan’s entire development budget
The Rs1 trillion figure refers to the federal PSDP, not every development project funded in Pakistan. The approved national development outlay for 2026–27 is broader: the federal PSDP is listed at Rs1 trillion, provincial Annual Development Programmes at Rs2.224 trillion and reported development investment by state-owned enterprises at Rs451 billion. Those components should not be added to the October federal expenditure figure as if they were all covered by the same monthly report.
The October sheet also separates federal ministries from corporations. Ministries and divisions had an allocation of about Rs682.49 billion and expenditure of Rs74.66 billion. Corporations had an allocation of about Rs312.51 billion and expenditure of Rs29.22 billion. Project liabilities and new initiatives make up the remaining small portions of the federal total.
What low utilisation can mean for people
Development spending becomes visible to the public only when a project moves through planning, procurement, construction, equipment installation and service delivery. If a road contract is not awarded, a water scheme has not acquired its land or a hospital project has not installed equipment, a budget allocation alone does not improve access.
At the same time, spending more money is not automatically a sign of better development. A rushed payment can still produce poor-quality work, cost overruns or a project that does not meet its intended purpose. The useful test is whether spending is matched by measurable progress and whether the project is likely to deliver the service promised.
How citizens can judge whether a project is progressing
For a major project in their district, residents, journalists and elected representatives can ask for more than the amount allocated. A practical monitoring checklist is:
- Identify the project: record its official name, location, sponsoring department and approved cost.
- Check the approval and scope: confirm what the project is meant to deliver and whether its design or cost has been revised.
- Look for procurement milestones: find out whether the tender was advertised, evaluated and awarded, and whether the contract is active.
- Compare financial and physical progress: ask how much has been spent and what has actually been built, installed or made operational.
- Check the completion date: compare the latest expected date with the original schedule and ask for reasons if it has changed.
- Verify the public benefit: a completed road, functioning water supply or staffed health facility matters more than a payment figure alone.
What should be watched in the next expenditure update?
The next monthly summary should show whether the gap between authorised funds and expenditure is narrowing. It will also help establish whether the low four-month utilisation is a temporary feature of the release calendar or a sign of project-execution problems. A more complete assessment would compare each project’s financial progress with its physical milestones and the approved quarterly release schedule.
Verity Pakistan has also examined the wider economic context in its analysis of Pakistan’s services exports and the continuing services trade deficit and its report on the revised GDP growth estimate. Development spending is one part of that picture: the quality, timing and completion of public projects help determine whether budget allocations translate into productive capacity.
Official programme data: Ministry of Planning — Public Sector Development Programme and October 2026 expenditure summary.
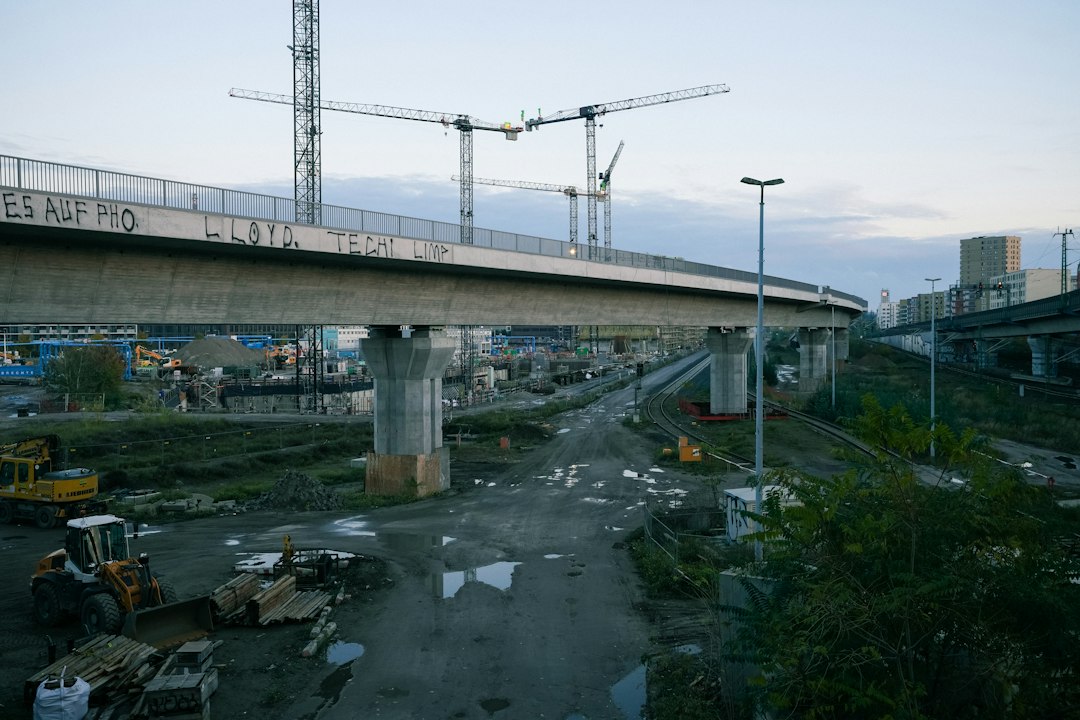
Illustrative photograph: road and bridge construction site; not a specific project listed in Pakistan’s PSDP. Photo by Max Langelott via Unsplash.