

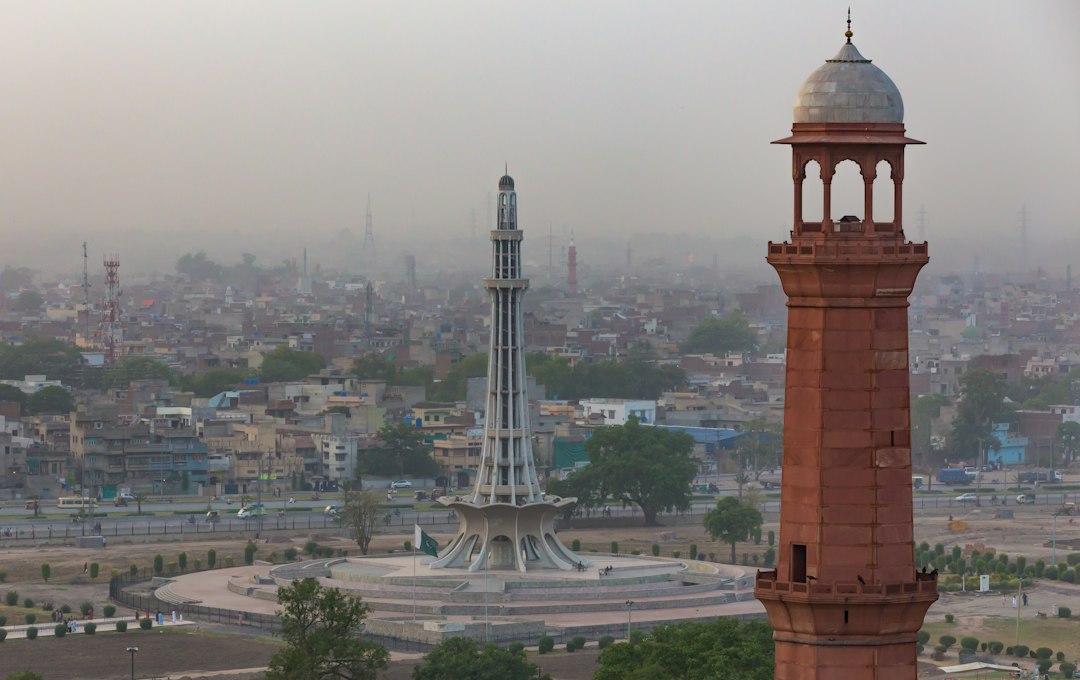
Lahore’s air pollution is a year-round problem, with winter weather and seasonal agricultural burning adding to a persistent baseline of fine-particle pollution. Local reporting on October 29 described Lahore among the most polluted major cities, while residents face the familiar combination of traffic emissions, industrial pollution, dust, crop-residue burning and weather conditions that can trap pollutants near the ground. Air quality changes throughout the day, so residents should check a current monitoring source instead of relying on a single headline or yesterday’s reading.
What year-round PM2.5 data reveal
A Hamari Hawa analysis released on 2 November found that Lahore’s monthly average PM2.5 concentration remained above 35 micrograms per cubic metre from October 2025 through October 2026. Even during the relatively cleaner months of April to September 2026, monthly averages ranged from 40 to 59 micrograms per cubic metre. October 2026 averaged 100 micrograms per cubic metre in the analysis.
The time period behind a standard matters. Pakistan’s 35 micrograms per cubic metre limit is a 24-hour standard, while the figures above are monthly averages. They cannot be compared as if they were identical measurements, and a monthly average does not show how many individual days crossed the 24-hour limit. The report also refers to an annual standard of 15 micrograms per cubic metre. Taken together, the data point to a persistent pollution baseline, not just a few winter episodes.
Latest city comparison — 7 November 2026
The Pakistan Air Quality Initiative’s daily station averages for 7 November showed the following PM2.5 concentrations:
| City | Daily mean PM2.5 | Monitoring stations shown |
|---|---|---|
| Multan | 235 µg/m³ | 10 |
| Lahore | 159 µg/m³ | 55 |
| Bahawalpur | 157 µg/m³ | 10 |
These are daily mean PM2.5 concentrations in micrograms per cubic metre, not AQI scores. They are averages of the monitoring stations shown by the initiative and are a one-day comparison, not a complete measure of each resident’s personal exposure or a long-term ranking of the cities.
Why the often-quoted transport figure needs context
Air-pollution source percentages can describe different things. An Urban Unit inventory published in 2023, using 2020–21 data for Lahore, attributed about 35 per cent of the city’s PM2.5 emissions to transport, 33 per cent to crop-residue burning, 29 per cent to waste burning and three per cent to industry.
This helps explain why the frequently repeated claim that transport causes 83 per cent of Lahore’s pollution should not be applied directly to PM2.5. That 83 per cent figure refers to all pollutants by mass and is dominated by carbon monoxide. It is not the transport share of fine-particle emissions. The inventory is also based on older emissions estimates; it is not a real-time measurement of the pollution people breathe today.
Why winter restrictions alone cannot solve the problem
Cold-season weather can make existing pollution more dangerous by reducing the depth of the air layer in which emissions mix. Crop-residue burning can add further particles during the same period. These seasonal effects sit on top of emissions that continue throughout the year, including traffic, waste burning, industrial activity, household fuels, construction dust and brick kilns.
Short-term restrictions can help manage severe episodes, but a lasting improvement requires year-round monitoring and enforcement. Transport measures need to address high-emitting vehicles and public-transport alternatives; waste policy needs reliable collection and disposal; industrial controls need credible inspections; and agricultural measures need workable alternatives to open-field residue burning.
Using air-quality information carefully
- Check the latest reading for your own area rather than relying only on a citywide headline.
- Check the pollutant and unit: PM2.5 concentration, AQI and a monthly average are not interchangeable.
- During severe pollution, reduce prolonged outdoor exertion and follow public-health and environmental advisories.
- Children, older adults and people with heart or lung conditions may need additional precautions; they should follow advice from their healthcare professionals.
- Do not treat one day’s reading as a forecast for the whole week. Weather and emissions can change quickly.
What the next useful update should measure
Readers need more than a daily city ranking. A stronger public record would show consistent station coverage, hourly and daily PM2.5 data, seasonal comparisons, pollutant-specific trends and the results of enforcement against major sources. That would help distinguish a short-lived improvement from a lasting reduction in exposure.
Earlier official dashboard snapshot — 3 November 2026
At 3:00 pm on Tuesday, 3 November 2026, the Punjab Environmental Protection Agency’s live dashboard reported Lahore’s citywide AQI at 181, classified as unhealthy for sensitive groups. Shahdara recorded 207, the highest reading among the listed Lahore stations at that time. The same dashboard showed a weekly peak of 500 at 9:00 am on 2 November, illustrating how sharply conditions can change by hour and neighbourhood.
Residents should check recent local readings before outdoor activity, reduce prolonged exertion during severe pollution and follow official health and environmental advisories. The city’s conditions can change quickly as wind, temperature and emissions change.
Why Lahore experiences severe smog
Smog is a mixture of air pollutants, including fine particulate matter such as PM2.5, and other gases. In Punjab, pollution can come from vehicle exhaust, industrial and brick-kiln emissions, construction dust, waste burning and agricultural residue burning. Calm winds, temperature inversions and dry conditions can limit the dispersal of pollution. No single source explains every high-pollution episode.
How to check the air quality index
Check a reliable, regularly updated air-quality monitor and note both the AQI category and the time of the reading. Measurements can differ by monitoring station and method. A citywide ranking is useful context, but conditions near a busy road or industrial area may differ from those in another neighbourhood.
When pollution is elevated, reduce strenuous outdoor activity, especially for children, older adults, pregnant people and anyone with asthma, heart disease or another respiratory condition. If local authorities issue restrictions or health advisories, follow the latest instructions.
Practical precautions during smog
- Move exercise and children’s outdoor play indoors when air quality is poor.
- Keep windows closed during severe pollution periods if indoor air is cleaner; ventilate when outdoor conditions improve.
- If available, use a properly sized HEPA air purifier in the room where family members spend the most time.
- When outdoor exposure cannot be avoided, a well-fitting N95 or equivalent particulate respirator can reduce inhalation of fine particles; cloth and loose-fitting masks offer much less protection.
- Avoid smoking, incense, and burning rubbish or biomass indoors, which can add to indoor pollution.
- Follow prescribed asthma or heart-disease treatment plans and keep necessary medicines accessible.
Who needs extra care?
Children, older adults and people with asthma, chronic lung disease or cardiovascular disease may be more sensitive to polluted air. Schools, employers and caregivers should use current local conditions to decide whether to move strenuous activities indoors. Anyone with a known medical condition should follow advice from their clinician.
When to seek medical help
Air pollution can irritate the eyes and throat and aggravate coughing, wheezing or shortness of breath. Seek urgent medical care for severe breathing difficulty, chest pain, fainting, confusion or blue/grey lips. If symptoms persist or an existing condition worsens, contact a healthcare professional rather than relying on home remedies.
What can reduce smog over the longer term?
Lasting improvement requires coordinated action: cleaner transport and fuel, enforcement of industrial emission standards, control of construction dust, alternatives to open waste burning, improved kiln technology and the field practices discussed in Verity Pakistan’s guide to Punjab’s crop-residue burning restrictions and wheat-sowing alternatives and practical support that helps farmers manage crop residues without burning. Monitoring should be transparent, and public advisories should clearly explain the location, timing and meaning of air-quality readings.
Frequently asked questions
Is Lahore’s air quality the same across the city?
No. Pollution levels can vary by neighbourhood, monitoring station, traffic and weather. Check recent local readings before making decisions.
Does a regular cloth mask protect against PM2.5?
A cloth mask generally does not provide reliable protection against fine particles. A well-fitting N95-type respirator offers better particle filtration when correctly worn.
Should I exercise outdoors during severe smog?
It is safer to avoid strenuous outdoor exercise when air quality is poor, particularly for people at higher risk. Choose indoor activity and follow current local health guidance.
Bottom line
Smog is not only a visibility problem; fine-particle pollution can affect health. Check current local readings, reduce exposure during high-pollution periods and take official advisories seriously. Long-term progress depends on sustained emission controls across transport, industry, waste management and agriculture.
Official live readings: Punjab EPA’s Lahore air-quality dashboard.